Every day, thousands of well-meaning pet parents open up a search engine, pull up a generic ideal dog weight by breed chart, and experience an immediate wave of anxiety. They look at their Labrador retriever, see the ribcage slightly shimmering under a sleek coat, and assume their companion is starving. Or, conversely, they look at their thick-set Bulldog, look back at the number on a standard spreadsheet, and begin an aggressive, dangerous caloric restriction program.
We have imported the toxic aesthetics of human diet culture directly into canine Dog Health. We are obsessing over flat numbers on a scale, chasing an arbitrary “beach body” ideal that ignores biological variance, bone density, and operational mechanics.
The truth is, a universal, flat-number weight target does not exist. An arbitrary spreadsheet cannot account for the massive genetic diversity within a single canine lineage, which is why a rigid ideal dog weight by breed chart can often mislead well-meaning owners.
A truly scientific approach to canine longevity rejects the scale in favor of body composition analysis. If you rely blindly on a one-size-fits-all ideal dog weight by breed chart, you risk keeping your dog in a state of hidden metabolic distress.
At STYPETS, we don’t look for runway models; we optimize for structural longevity and biomechanical efficiency. This masterclass will provide you with a comprehensive, professional-grade diagnostic framework to move past a basic ideal dog weight by breed chart and find your individual dog’s metabolic sweet spot.
1. Why Generic Charts Fail the Genetic Reality Check
The fundamental flaw of almost every standard online chart is the assumption that breed standards are uniform. A female, field-line (American) Labrador bred for high-drive duck retrieval may weigh 55 pounds and be perfectly healthy. Meanwhile, a male, bench-line (English) Labrador bred for conformation shows might weigh 85 pounds and carry the exact same body fat percentage.
[Field-Line Labrador]  ──> Sleek, High Athletic Drive ──> 55-65 lbs (Healthy)
[Bench-Line Labrador]  ──> Dense Bone, Blocky Frame  ──> 75-85 lbs (Healthy)
If you apply a rigid ideal dog weight by breed chart to these two distinct genetic archetypes, you will either overfeed the athlete or starve the show dog. This structural divergence exists across dozens of popular breeds, making basic weight scales a secondary diagnostic tool at best.
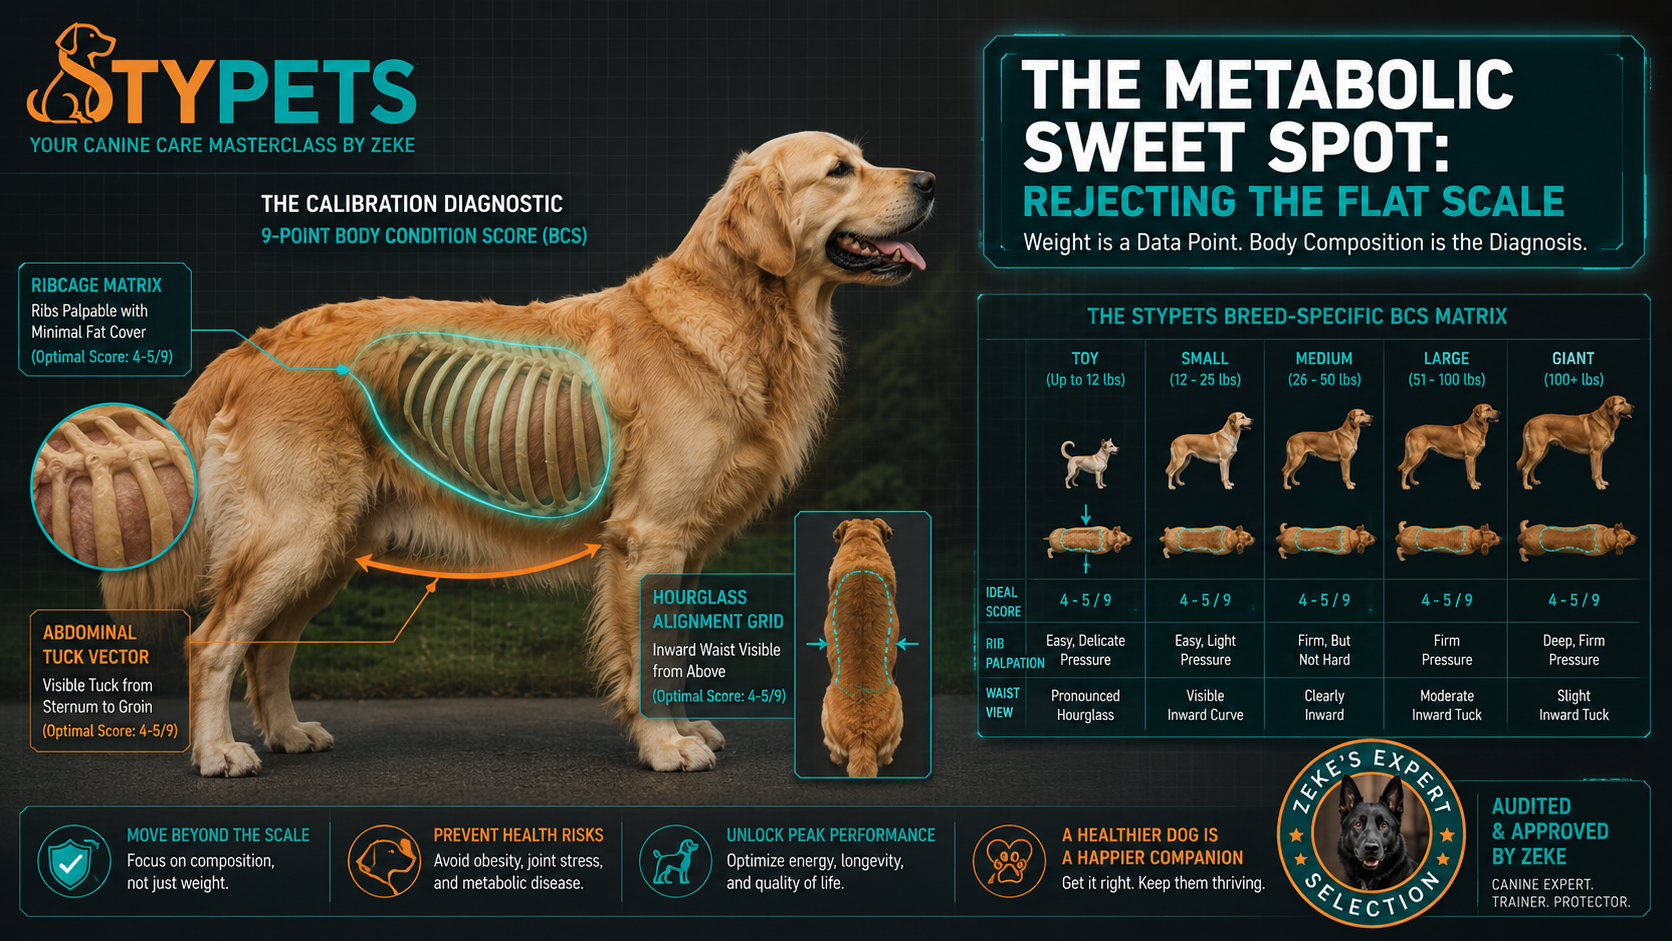
Instead of treating the number on a standard ideal dog weight by breed chart as an absolute truth, we must view it as a loose baseline. The real metric of success is the Body Condition Score (BCS), a clinical evaluation tool used by veterinary oncologists and orthopedic surgeons worldwide to map real fat distribution against lean muscle tissue.
2. The STYPETS Interactive Ideal Dog Weight by Breed Chart
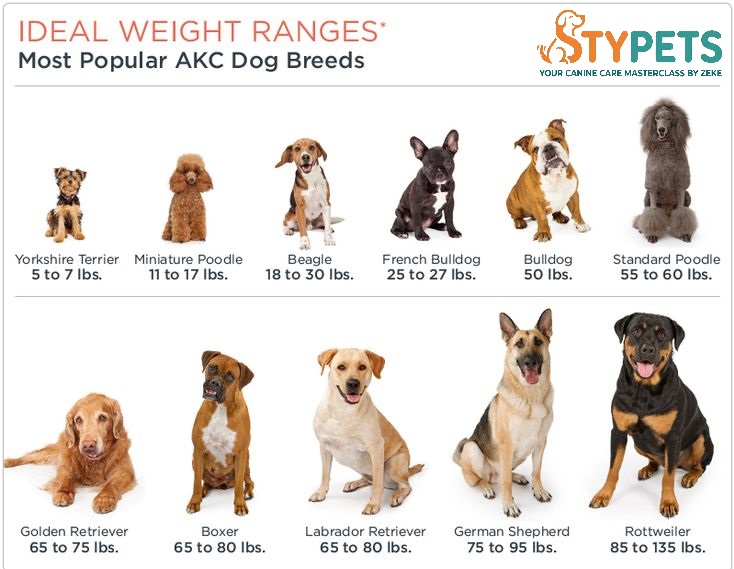
To give you an accurate, data-driven starting point, we have built a functional ideal dog weight by breed chart that separates distinct structural categories. Use these ranges as broad guidelines, not strict rules.
| Breed Group & Example | Structural Target Baseline | Primary Metabolic Risk Profile |
| Toy Breeds (e.g., Chihuahua, Yorkie) | 4 – 12 lbs | High risk for acute hypoglycemia and rapid joint loading |
| Brachycephalic (e.g., French Bulldog, Pug) | 16 – 28 lbs | Extreme vulnerability to respiratory distress from visceral fat |
| Sighthounds (e.g., Whippet, Greyhound) | 25 – 40 lbs | High baseline risk for hypothermia if BCS drops below a 4 |
| Retrievers / Working (e.g., Lab, GSD) | 55 – 85 lbs | Extreme risk for structural hip dysplasia and ACL degradation |
| Giant Breeds (e.g., Great Dane, Mastiff) | 110 – 180+ lbs | Accelerated skeletal aging; extra weight shortens lifespan dramatically |
💡 Featured Snippet Diagnostic: The 3-Step Body Condition Score (BCS) Test
To accurately find your dog’s metabolic sweet spot without relying on a rigid ideal dog weight by breed chart, execute this three-step physical assessment:
The Palpation Step: Run both palms flat across your dog’s ribcage. You should feel individual ribs easily, covered by a thin layer of fat, feeling similar to the knuckles on the back of your hand.
The Aerial Profile Step: Stand directly above your dog and look down. You should see a distinct, clean inward curve behind the ribcage, creating an hourglass silhouette.
The Lateral Tuck Step: Kneel beside your dog at eye level. View their underline; it should slope upward from the end of the ribcage toward the groin, forming a clear abdominal tuck.
3. The Danger of Over-Conditioning: Visceral Fat and Inflammatory Storms
When a dog sits persistently above a Body Condition Score of 6 out of 9, they are carrying a dangerous accumulation of visceral fat wrapped around their vital organs, regardless of what an ideal dog weight by breed chart might recommend for their size.
The Cellular Cost of Excess Mass
In modern canine care, carrying too much weight is a primary driver of chronic, low-grade metabolic inflammation. White adipose tissue (fat) is not an inactive storage zone; it is a highly active endocrine organ that pumps out inflammatory proteins called adipokines.
This continuous release of inflammatory markers creates an internal environment that speeds up cellular aging and directly triggers common health problems:
-
Structural Joint Degradation: Every extra pound puts continuous mechanical stress on a dog’s joints. For deep-chested, large breeds, carrying extra mass speeds up the breakdown of cartilage, leading to early osteoarthritis and costly cranial cruciate ligament (CCL) tears.
-
Metabolic Exhaustion: Chronic obesity wears down insulin receptors, leaving your dog sluggish, lethargic, and unable to properly process nutrients.
-
Cardiorespiratory Stress: Excess fat forces the heart to pump harder to oxygenate tissue while physically crowding the lungs, a dangerous combination for flat-faced breeds already dealing with compromised airways.
4. The Pitfalls of Under-Conditioning: Sarcopenia and Immune Compromise
While keeping a dog exceptionally lean is popular in high-performance sports, dropping far below the parameters of an ideal dog weight by breed chart carries its own set of serious biological risks. An underweight dog is highly vulnerable to systemic failures.
The Danger of Muscle Wasting
When a dog’s body fat drops below an optimal level, the system enters a catabolic state, breaking down its own tissues for basic survival. This leads to sarcopenia, the progressive loss of lean skeletal muscle mass.
[Systemic Caloric Deficit] ──> Catabolic Shift ──> Sarcopenia (Muscle Loss) ──> Structural Joint Failure
Without adequate muscle mass to support the skeletal frame, your dog’s joints absorb the full force of every impact, accelerating wear and tear. Furthermore, amino acids harvested from muscle are diverted away from the immune system, leaving your dog with fewer defenses against pathogens, slowing down wound healing, and causing chronic coat issues.
5. How to Tune Your Dog to Their Personal Weight Sweet Spot
If your dog is sitting outside their ideal range on your assessment, do not make sudden, drastic adjustments to their food bowl simply to force them to match an online ideal dog weight by breed chart. Transforming your dog’s body composition requires a steady, systematic approach.
The Metabolic Readjustment Protocol
-
Ditch the Measuring Cup: Standard plastic measuring cups are highly inaccurate, often leading to overfeeding by up to 20%. Switch to a digital kitchen scale and weigh your dog’s food in grams for precise portion control.
-
Track Weight as a Percentage: A loss of one pound means very little to a Golden Retriever, but it represents a massive 10% drop in body mass for a ten-pound Shih Tzu. Aim for a safe, steady fat loss rate of 1% to 2% of total body weight per week rather than forcing a rapid shift toward an ideal dog weight by breed chart baseline.
-
Optimize the Protein-to-Calorie Ratio: When reducing calories, do not simply feed less of a low-quality kibble. Doing so can inadvertently cause protein malnutrition. Instead, switch to a nutrient-dense, high-protein formula to preserve lean muscle tissue while the body burns through excess fat stores.
FAQ: Advanced Canine Weight Dynamics
1. Why does my dog look skinny but weigh more than the ideal dog weight by breed chart?
Muscular conditioning and bone density vary widely. Muscle tissue is significantly denser than fat tissue. A working dog with excellent lean muscle mass will often weigh more than a sedentary dog of the exact same size, meaning they may sit at the high end or just past an ideal dog weight by breed chart while remaining perfectly healthy.
2. Can a sudden weight shift indicate an underlying health issue?
Yes. Unexplained weight gain while on a strict diet often points to metabolic disorders like hypothyroidism or Cushing’s disease. Conversely, sudden weight loss that drops a dog completely below their standard ideal dog weight by breed chart baseline is a classic warning sign of intestinal parasites, early-stage diabetes, or metabolic waste from a hidden malignancy.
3. Is a visible ribcage always a sign that a dog is underweight?
Not necessarily. For sighthounds like Greyhounds, Whippets, and Salukis, seeing the faint outline of the last two or three ribs is completely normal and healthy for their specific body structure, even if they look underweight compared to a standard, non-specific ideal dog weight by breed chart.
4. How does spaying or neutering affect my dog’s ideal weight?
Altering a dog changes their hormonal profile, which can lower their baseline metabolic rate by up to 30%. After the procedure, their daily caloric needs drop. If you don’t adjust their food intake downward, they can quickly gain excess body fat and climb past their target numbers on an ideal dog weight by breed chart.
5. Why is visceral fat more dangerous than subcutaneous fat?
Subcutaneous fat sits just beneath the skin and functions primarily as insulation. Visceral fat wraps deeply around internal organs like the liver and kidneys, actively releasing inflammatory markers that disrupt normal organ function.
6. Can I use a human scale to track my small dog’s weight?
Human scales are not calibrated to track small, ounce-level shifts accurately. For precise monitoring of toy and small breeds to see where they land on an ideal dog weight by breed chart, use a digital pet scale or weigh yourself holding the dog on a reliable digital scale, then subtract your own weight to find the difference.
7. Does extra weight affect how long a dog lives?
Yes. Major long-term veterinary studies show that dogs maintained at an optimal, lean body condition score live up to 1.8 to 2 years longer than their overweight littermates, while enjoying significantly delayed onset of chronic diseases.
Conclusion: Look at the Animal, Not the Spreadsheet
True expertise in Dog Health requires looking past static charts. An online reference can give you a starting baseline, but an automated ideal dog weight by breed chart cannot see the unique animal standing in front of you.
Stop chasing an arbitrary weight target on a scale. Focus on physical touch, visual outlines, and muscle retention. By tuning your dog to their personal metabolic sweet spot, you protect their joints from unnecessary strain and build a strong foundation for a long, vibrant life.
-
The World Small Animal Veterinary Association (WSAVA) for their international 9-point Body Condition Score reference charts.
-
The Association for Pet Obesity Prevention (APOP) for annual research statistics on canine metabolic health trends.